
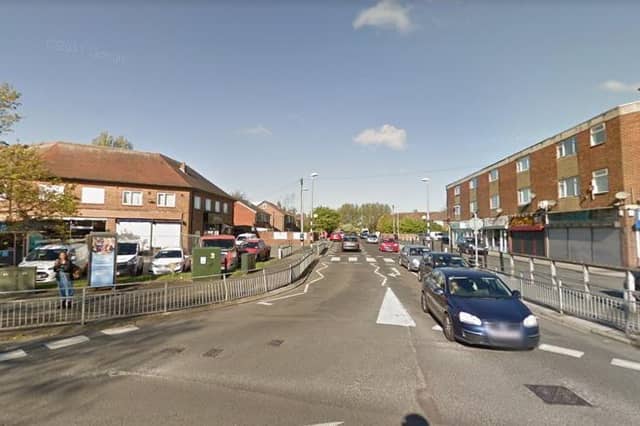


While house price growth in the UK has stalled in recent years, with data from Rightmove showing that the average asking price in the UK fell by 0.9 per cent between April 2025 and April 2026, house prices have risen by a staggering amount in the first quarter of the 21st century.
In Yorkshire, several neighbourhoods have seen prices rise by more than 500 per cent, with some exceeding 600 per cent between September 2000 and September 2025.
To put that into context, if house prices had risen in line with inflation, the Bank of England predicts they would have increased by a mere 91 per cent during that period - significantly below the actual figures.
Below are the 15 neighbourhoods in Leeds where house prices increased by the greatest percentage between September 2000 and September 2025, according to the latest data from the Office for National Statistics, starting with the lowest:
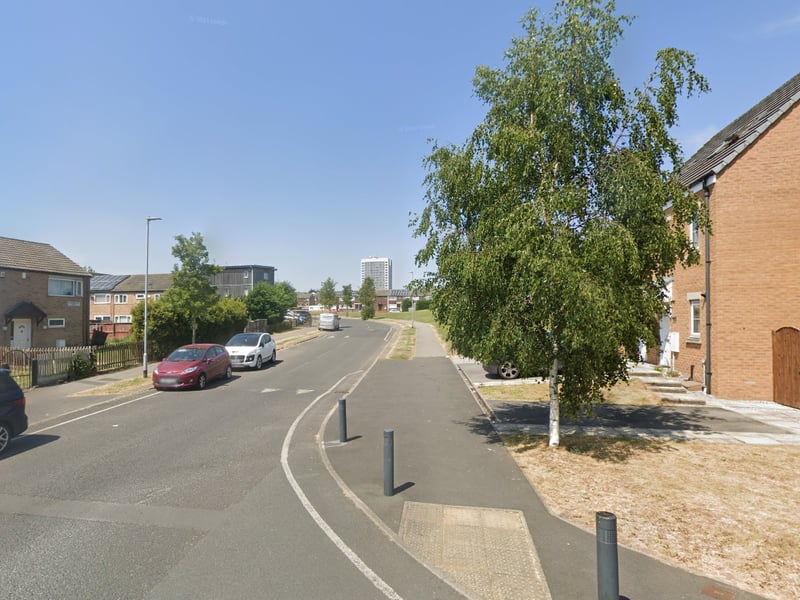
7. Swarcliffe: 444.12%
The average house price in Swarcliffe has risen by 444.12%, from £34,000 in September 2000 to £185,000 in September 2025 | Google
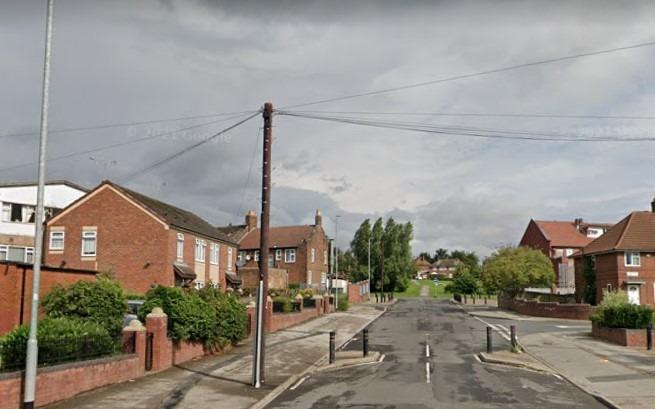
8. Gipton South & Killingbeck Park: 445.45%
The average house price in Gipton South & Killingbeck Park has risen by 445.45%, from £33,000 in September 2000 to £180,000 in September 2025 | Google
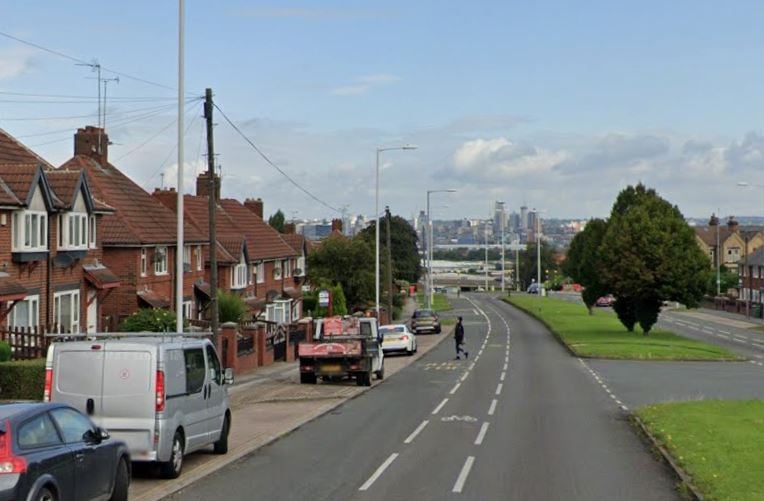
9. Belle Isle North: 475.22%
The average house price in Belle Isle North has risen by 475.22%, from £28,250 in September 2000 to £162,500 in September 2025 | Google
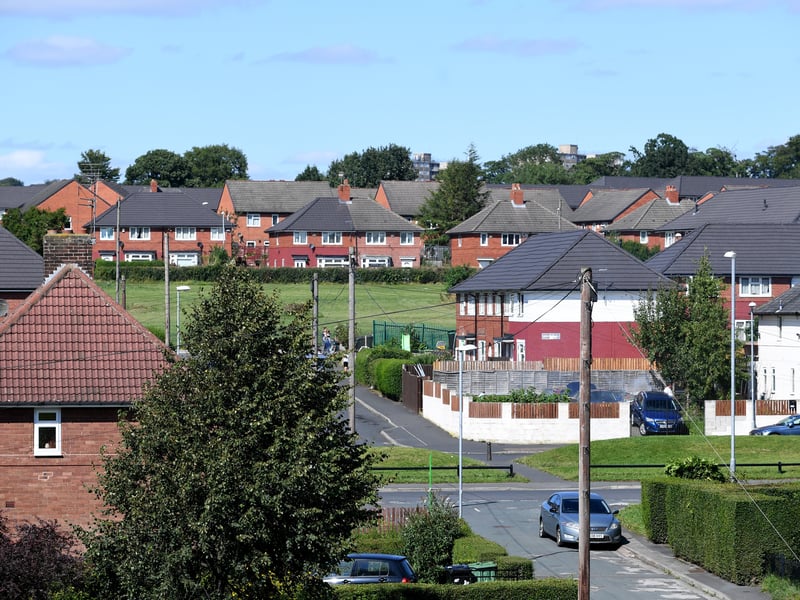
10. Seacroft South: 483.33%
The average house price in Seacroft South has risen by 483.33%, from £36,000 in September 2000 to £210,000 in September 2025 | Iconic Media Group
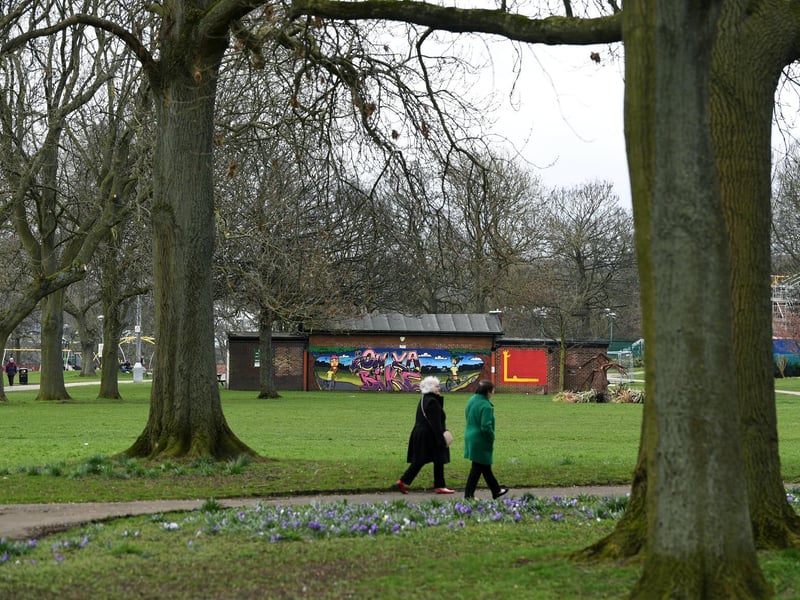
11. Cross Flats Park & Garnets: 521.62%
The average house price in Cross Flats Park & Garnets has risen by 521.62%, from £18,500 in September 2000 to £115,000 in September 2025 | Iconic Media Group
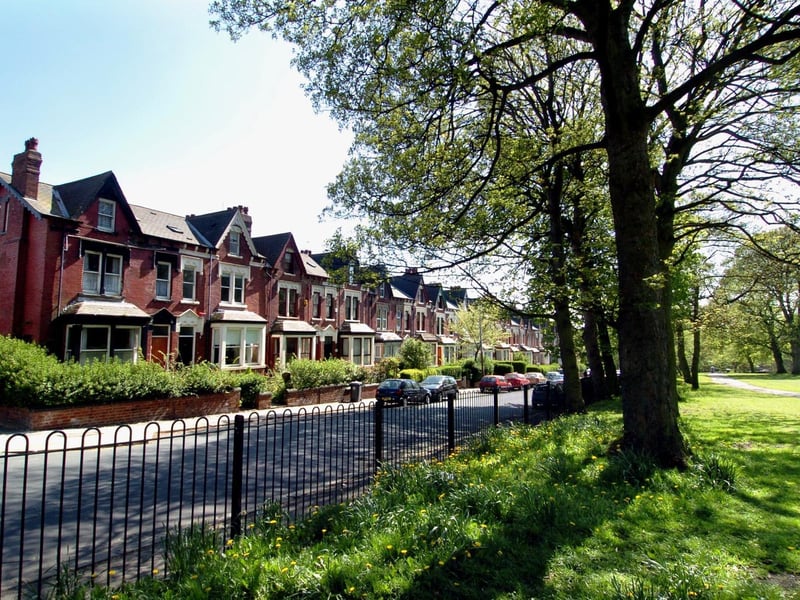
12. Chapel Allerton South & Chapeltown: 564.73%
The average house price in Chapel Allerton South & Chapeltown has risen by 564.73%, from £34,600 in September 2000 to £229,995 in September 2025 | Iconic Media Group