
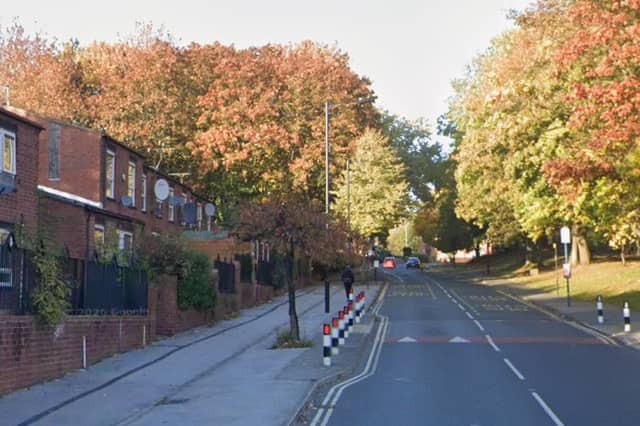


House price growth may have slowed in recent years, with the latest Rightmove report showing the average asking price in the UK actually fell by 0.9% between April 2025 and April 2026.
But house prices have still risen by a staggering amount over the last 25 years.
Greater Manchester has seen the biggest house price inflation, according to the latest figures from the Office for National Statistics.
The cost of the average home in some neighbourhoods there has soared by more than 1,000% between September 2000 and September 2025.
Parts of Yorkshire aren’t too far behind, with several neighbourhoods within the region recording rises of more than 500%, and some seeing average house price increases north of 600%.
To put that into context, if house prices had risen in line with inflation, according to the Bank of England tracker, they would have increased by 91.1% during that period.
Below are the places within Yorkshire where house prices have risen by the greatest percentage between September 2000 and September 2025, according to the latest Office for National Statistics data, listed in reverse order.
Is your neighbourhood among them?
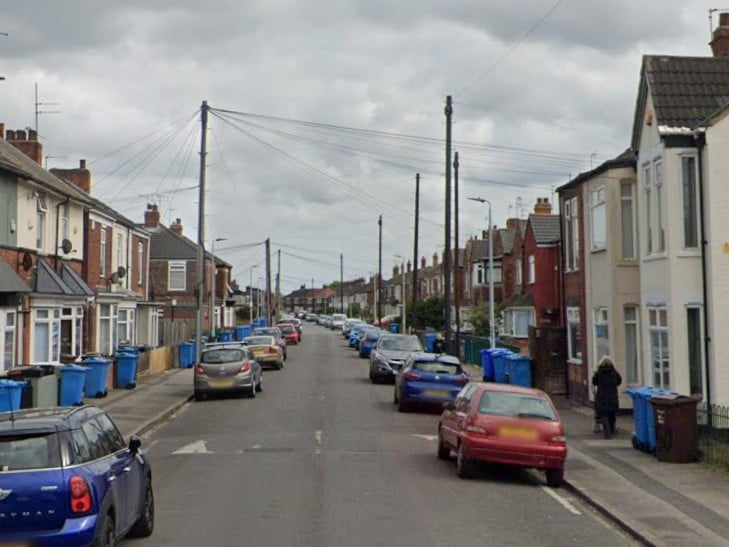
13. Southcoates East: 650%
The average house price in Southcoates East, Hull, has risen by 650%, from £26,000 in September 2000 to £195,000 in September 2025 | Google Photo: Google
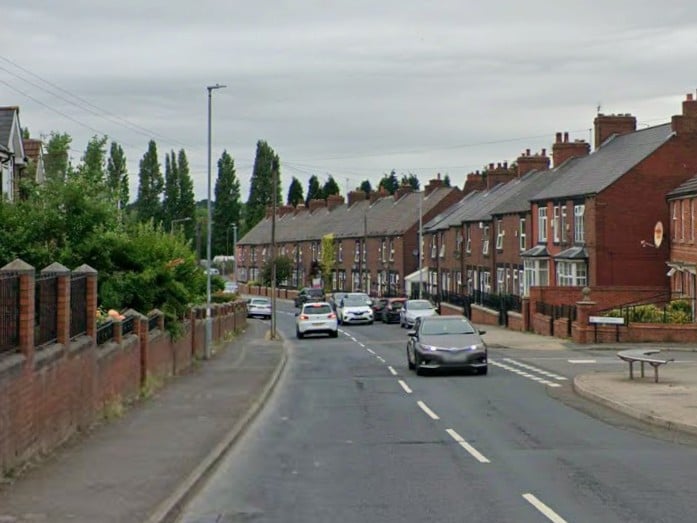
14. Grimethorpe & Brierley: 668.1%
The average house price in Grimethorpe & Brierley, Barnsley, has risen by 668.1%, from £22,750 in September 2000 to £174,750 in September 2025 | Google Photo: Google