

Police data, made available on Leeds Observatory, shows the burglary rate per 1,000 people in each Leeds ward area from June 2024 to May 2025.
There were 6,552 crimes of this nature recorded across the city during this 12 month period.
West Yorkshire Police’s Easy Street campaign gives advice to residents on reviewing their home security, as well as raising awareness of what makes homes an easy target for burglars.
Securing all locks and windows and making sure they meet minimum security standards, keeping valuables out of sight, growing hardy bushes and shrubs and installing dusk to dawn lighting can all reduce the risk of being burgled.
Listed below in descending order are the Leeds neighbourhoods with the most burglary offences. All images are for illustrative purposes and do not represent a specific incident or location
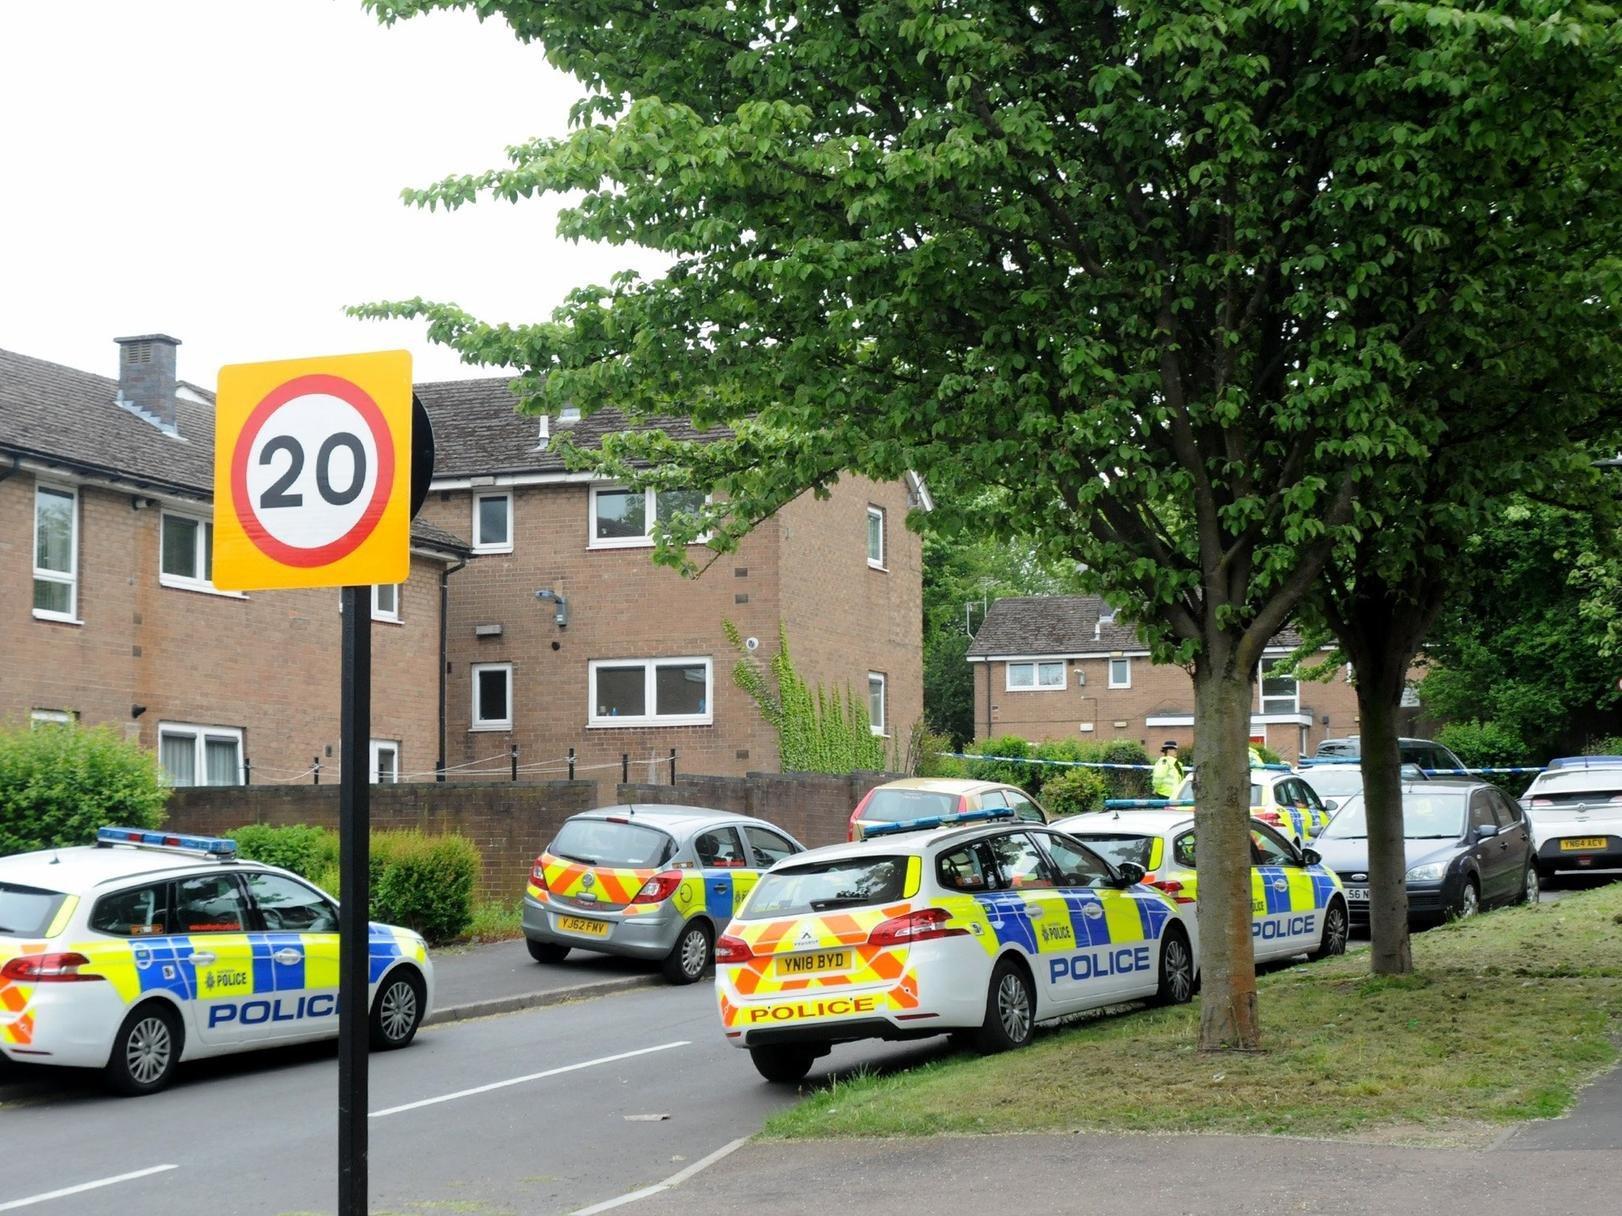
1. Little London and Woodhouse
The Little London and Woodhouse ward area, which includes the northern part of Leeds city centre, recorded the highest rate of burglaries between June 2024 and May 2025, with 16.2 recorded per 1,000 people | jpimedia
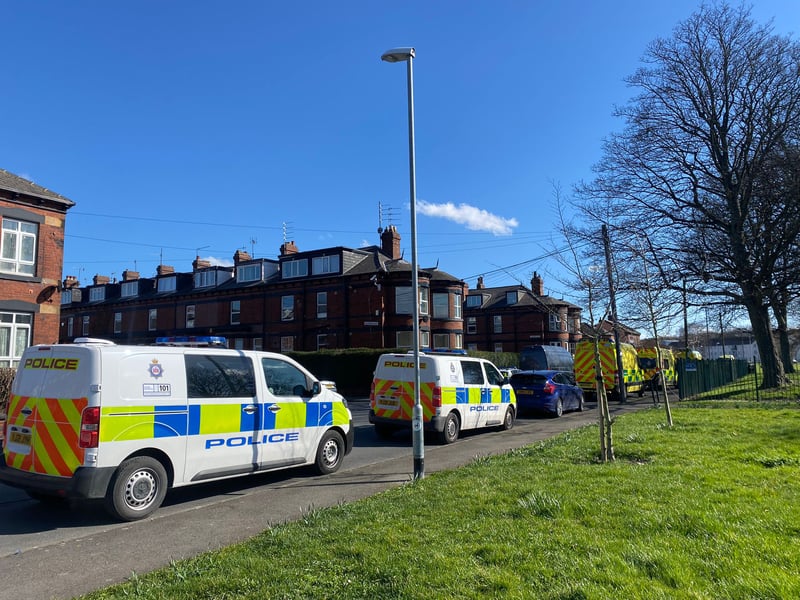
2. Hunslet and Riverside
The Hunslet and Riverside ward, which covers the southern area of the city centre, had the second highest rate of burglaries in Leeds, with 14.99 reported per 1,000 people. | JPIMedia
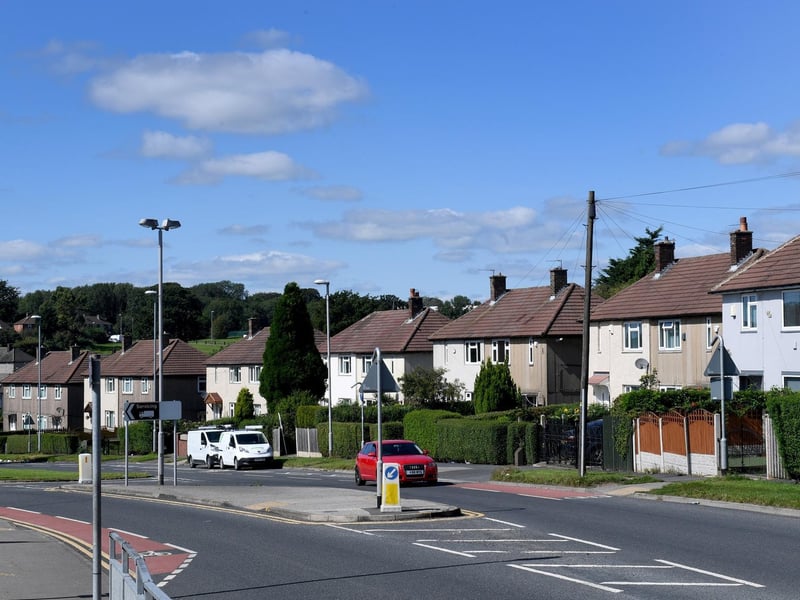
3. Killingbeck and Seacroft
The Killingbeck and Seacroft ward area had a rate of 13 burglaries per 1,000 people between June 2024 and May 2025. | National World
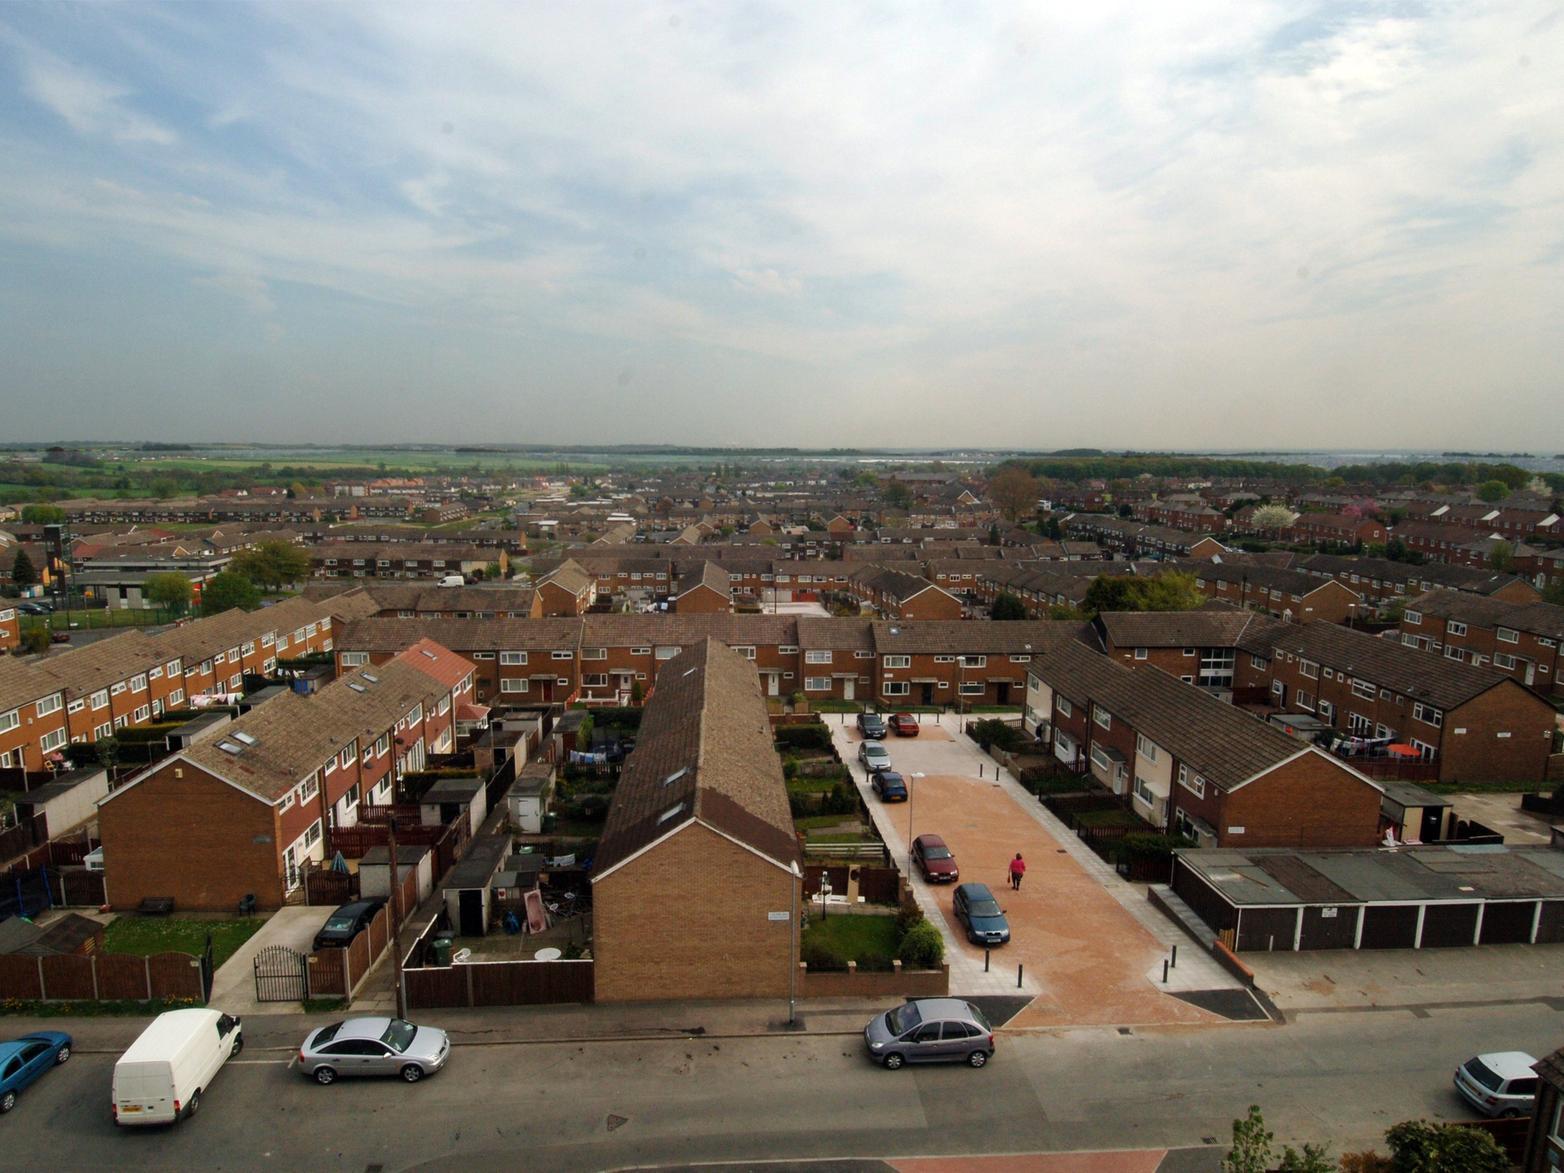
4. Cross Gates and Whinmoor
The Cross Gates and Whinmoor ward had a rate of 11.89 burglaries per 1,000 people between June 2024 and May 2025. | jpimedia
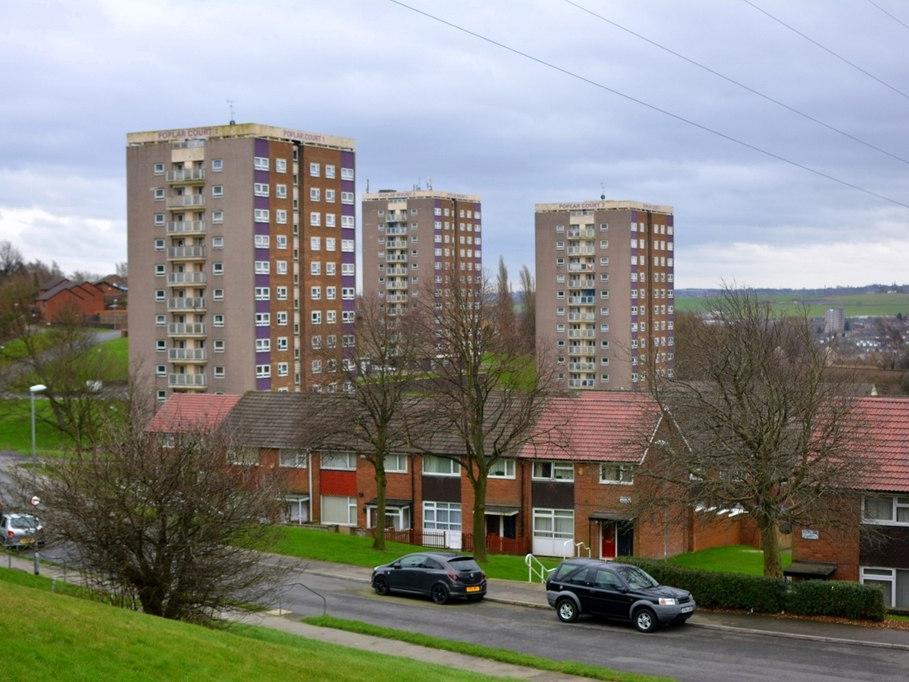
5. Bramley & Stanningley
The Bramley and Stanningley ward had burglary rate of 11.75 per 1,000 people between June 2024 and May 2025 | other Photo: Mark Stevenson (cc-by-sa/2.0)
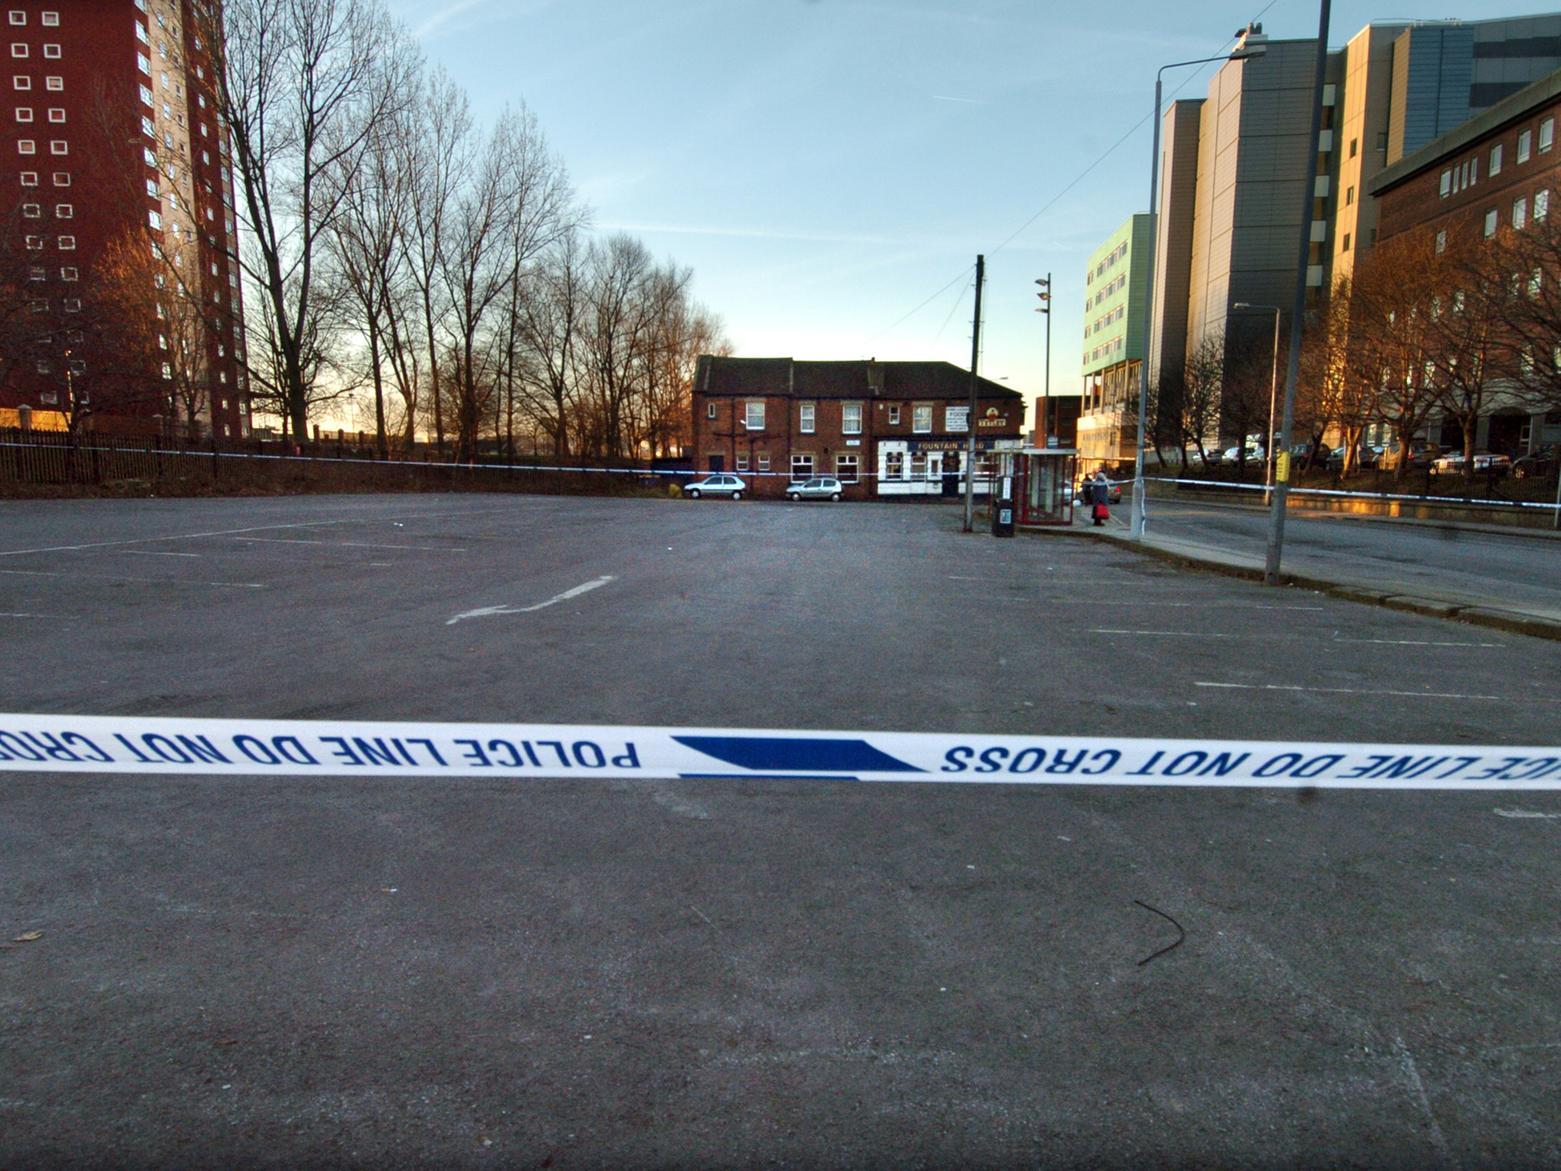
6. Burmantofts and Richmond Hill
The Burmantofts and Richmond Hill had a burglary rate of 11.53 per 1,000 people between June 2024 and May 2025. | jpimedia