
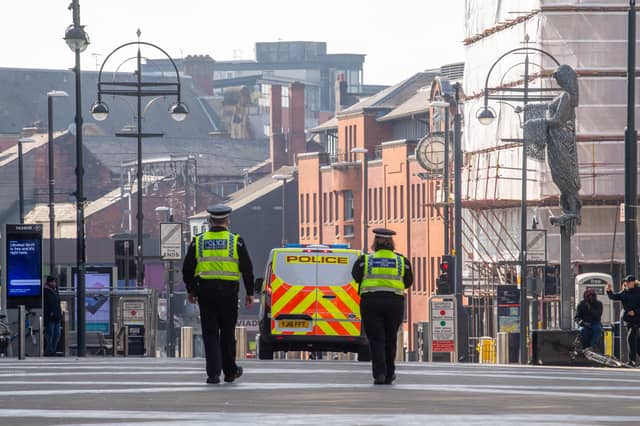


The latest data, pulled from the Leeds Observatory, covers every burglary recorded across the city between January 2025 and December 2025 that was not later cancelled.
During these 12 months, the statistics show a significant concentration of activity in specific urban and residential hubs, often reflecting the unique security challenges faced by different parts of the city.
A total of 5,768 burglary offences were reported across the neighbourhoods included in the list.
To help you understand the trends in your community, we have broken down the statistics by middle super output area - neighbourhoods which usually include around 2,000-6,000 households.
Below are the 15 most burgled Leeds neighbourhoods, ranked in descending order based on the total number of offences recorded.
All images are for illustrative purposes and do not represent a specific incident or location.
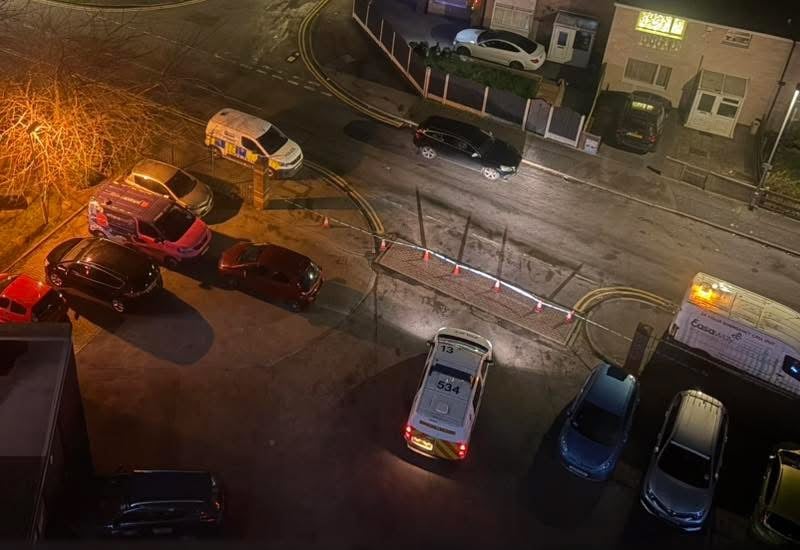
7. Burmantofts
Burmantofts reported 97 burglaries that took place between January 2025 and December 2025. | Contributed
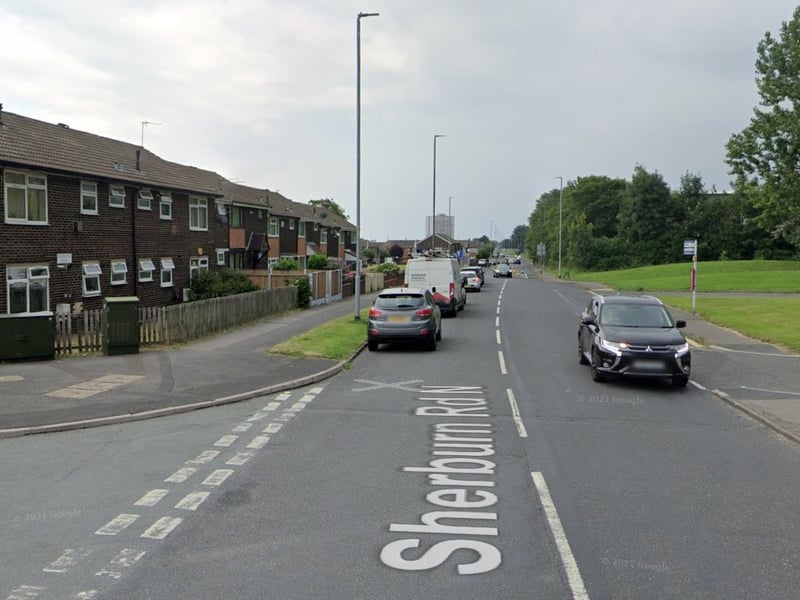
8. Whinmoor
Whinmoor reported 95 burglaries that took place between January 2025 and December 2025. | Google Photo: Google
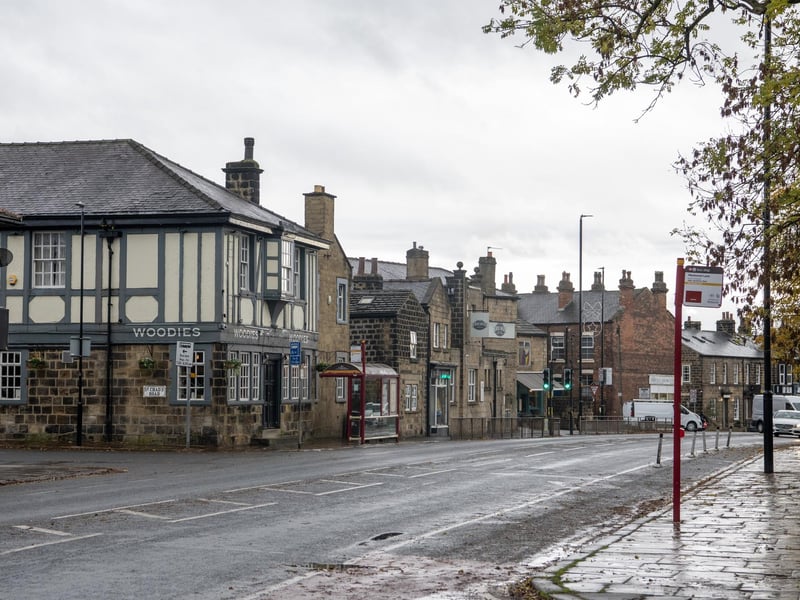
9. Headingley
Headingley reported 94 burglaries that took place between January 2025 and December 2025. | Tony Johnson
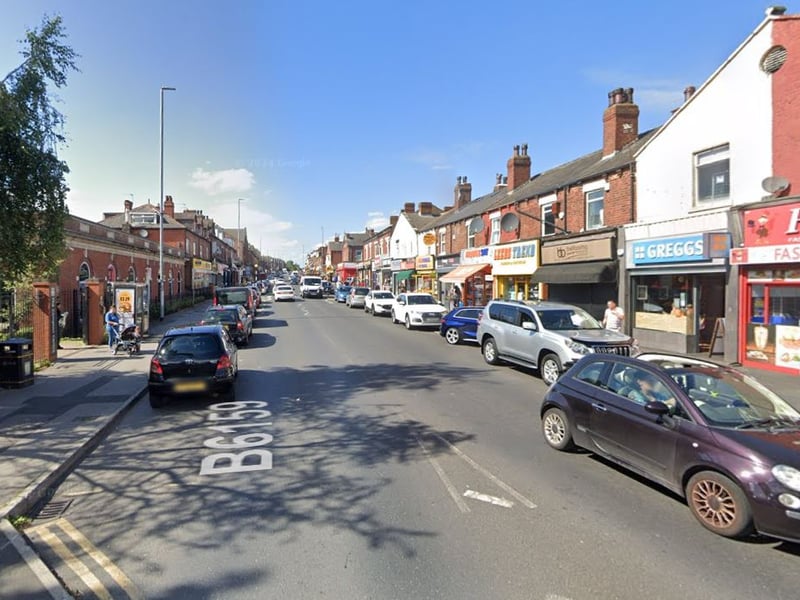
10. Harehills South
Harehills South reported 91 burglaries that took place between January 2025 and December 2025. | Google
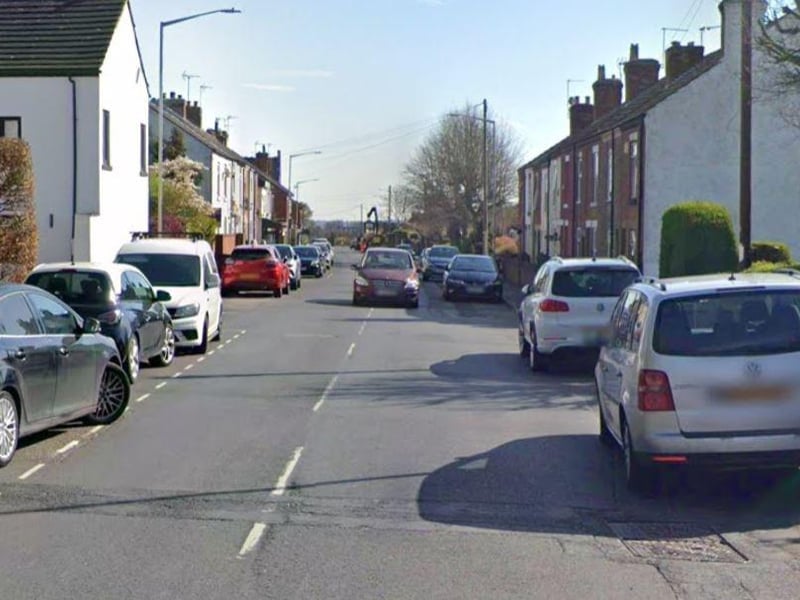
11. Woodhouse & Little London
Woodhouse & Little London reported 89 burglaries that took place between January 2025 and December 2025. | Google
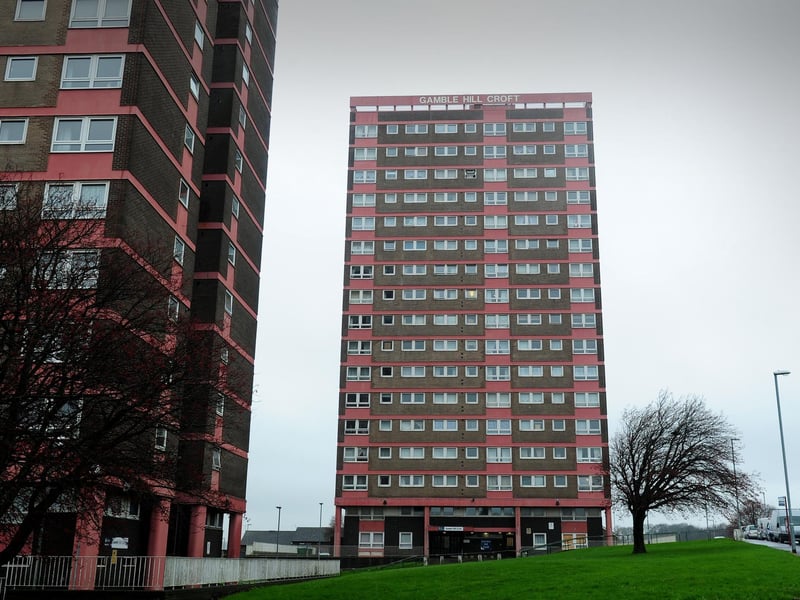
12. Bramley South & Upper Armley
Bramley South & Upper Armley reported 87 burglaries that took place between January 2025 and December 2025. | Simon Hulme